Screen2.0
archive // 2006.06.09 08:17:19 [hh]
"Websites as Graphs": Site Maps mal anders

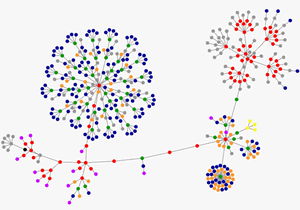
So sieht Screen2.0 als Graph aus. Visualisiert wurde unsere Web-Site mit einem kleinen Online-Tool in Form eines Java-Applets. Screen2.0 stellt ein interessantes kleines Projekt zur Visualisierung vor.
Das bedeuten die Farben (Informationen von der Web-Site):
"blue: for links (the A tag)
red: for tables (TABLE, TR and TD tags)
green: for the DIV tag
violet: for images (the IMG tag)
yellow: for forms (FORM, INPUT, TEXTAREA, SELECT and OPTION tags)
orange: for linebreaks and blockquotes (BR, P, and BLOCKQUOTE tags)
black: the HTML tag, the root node
gray: all other tags"
Weitere Informationen: www.aharef.info/ static/ htmlgraph
Der "Processing"-Code des Projektes kann hier heruntergeladen werden: www.aharef.info/ static/ htmlgraph/ sourcecode.html
Werbung


